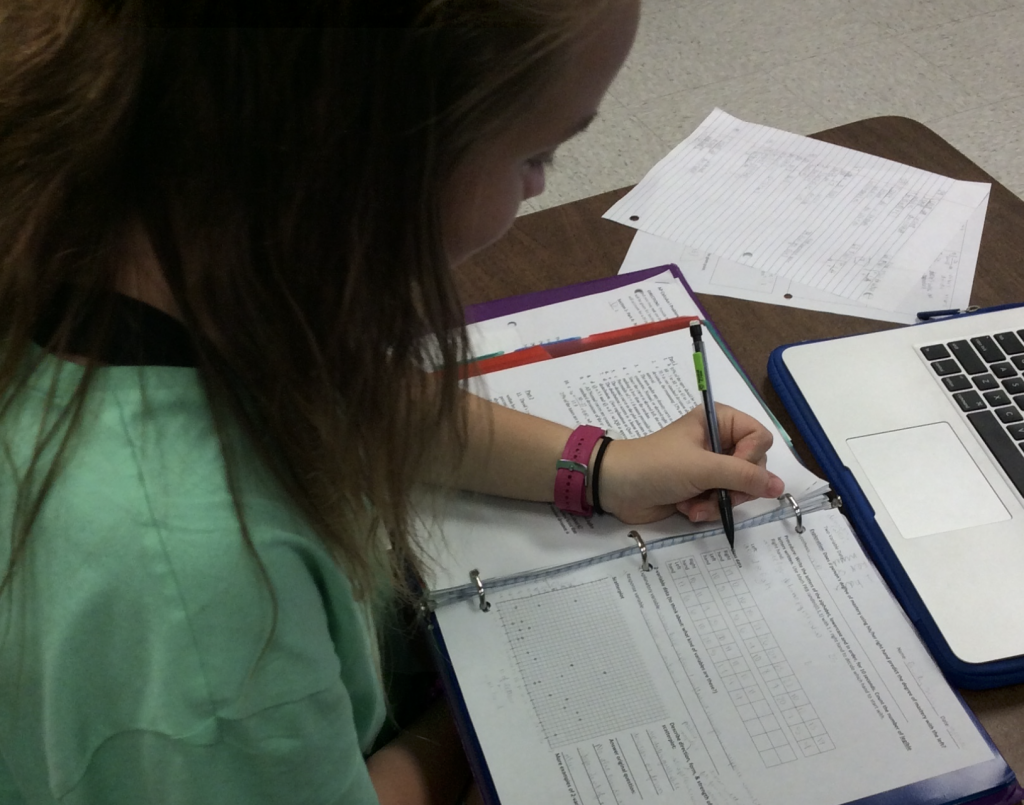
In AP Statistics I this week, taught by Kishan Patel, students received an introduction to the analysis of two-variable data. In class, they participated in an exciting activity to kick the unit off. In order to determine if the speed at which students could write with their right hand affected the speed of the left, students were instructed to write as many (legible!) letters of the alphabet as they could in ten seconds with both of their hands (the hand with which they begun was randomly assigned). The data collected from students ranged impressively from the entire alphabet written out in ten seconds, to a mere four words. Not only did this activity provide a response to the interesting question posed above, but it also provided a unique data set with which the students could practice graphing. Notably, outliers of the set were caused by the few students whose dominant hand was their left, not their right, and also by the several ambidextrous students!
“While a good classroom exercise, I was the only left-handed person in the room. I knew going into it that I was going to be an outlier, which I’m very used to as a left-handed person in a right-handed world,” said MSMS student Claudia Vial.
And, in case you were wondering, the conclusion at the end of the activity was that proficiency with one hand had no bearing on the proficiency of the other, which led to the creation of quite the scattered scatter plot.